Operational Research
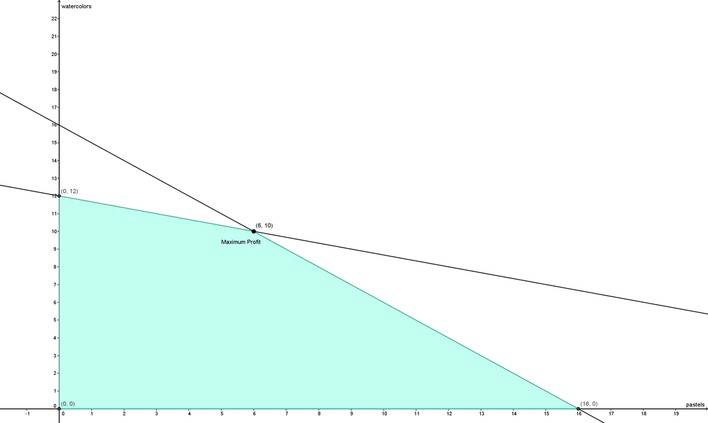
In class we were assigned groups and given a problem involving two variables and a client and we had to make a recommendation based on the dilemma. The problem we had involved an art exhibit and the artist wanted to make the greatest profit by painting a certain amount of watercolors and pastels. Each art piece created a different profit and we were asked to recommend which amount would create the greatest total profit. My group and I started by determining the x and y coordinates (the two options). We decided x would represent pastels and y would represent watercolors. The next step we completed, was to identify and write the constraints. The contraint for time was x + y <= 16. The artist only has time to make 16 paintings so the amount of pastels plus and amount of watercolors can not be greater than 16. The next constraint we found was 5x + 15y >= 180. It costs 5 dollars to make a pastel painting and 15 dollars to make a watercolor painting. However, the artist only had 180 dollars to spend on supplies. We also created the constraints x>= 0 and y>=0. It is impossible to have a negative amount of paintings so we determined it had to be greater than or equal to zero. The next step, was to input all of the information we had gathered into GeoGebra. We started by labeling the x and y coordinates pastel and watercolor. We then inserted our constraints but we changed the greater than or less than symbol into an equal sign making it an equation of a line. We chose to do this because it helped us keep our graph clean and legible because when they are kept as inequalities they shade in regions making it hard to read labels. Once we had all of our lines graphed we used to the intersection tool to find where the lines intersected and plotted the points. Next, using the intersection points we used the polygon tool to highlight the feasible region. The feasible region represents the infinite amount of possibles that would satisfy all the constraints. The next thing we did was write the equation for the total profit which was 40x+100y=profit. The artist makes a profit of 40 dollars on a single pastel painting and 100 dollar profit on each watercolor painting they sell. We then plugged in the x and y coordinates of each intersection point into the equation for profit. The points we tested from our feasible region were (0,12) (6,10) and (16,0). We also had (0,0) in our feasible region but we eliminated it because we knew it would create zero profit. When the artist creates and sells 0 pastels and 12 watercolors, the artists makes a profit of $1,200. When they make and sell 6 pastel and 10 watercolor paintings they make a profit of $1,240. And lastly, when the artist makes and sells 16 pastels and 0 watercolor, they make a profit of $640. We then compared all the final profits and found the greatest one and saw which x and y values we used. We then had our answer. We discovered that the artist generates the greatest profit when they create and sell 6 pastel and 10 watercolor paintings and that was our recommendation to our client.
The Artist Dilemma
Natalie, John, Sandra, and Lizzy
Natalie, John, Sandra, and Lizzy
I had Lizzy, Sandra, and John in my group. I was the spokesperson and I was responsible for sharing all of our ideas and thoughts with the client. Sandra was the GeoGebra Guru and was responsible for inputting the information onto GeoGebra and making the graph. Lizzy was the documenter and recorded all of our calculations and notes on paper. And lastly John was our facilitator and was responsible for keeping the group focused and on track. I think we engaged with our clients very well. Everyone knew their roles very well and went above and beyond their role to help the group succeed as a whole. Sandra did a really good job communicating and clarifying any of the information so it was inputted into GeoGebra correctly. John did a good job of answering questions and remained collected when called on specifically to clarify or explain something. Lizzy did an excellent job keeping all the information organized and contributed a lot of ideas and thoughts. I think I did a good job of explaining all the information thoroughly to the client and kept all the group members engaged. The Habit of a Mathematician I used the most was describe and articulate. I translated a lot of the groups ideas and thoughts into an actual plan and then explained that to the clients. The group worked really well together so we were able to complete the problem very quickly. Because we had time left over, the clients kept on asking us deeper thinking questions and some of them were pretty challenging. At times we weren't totally sure what the answer was but we used logic and reason and past experiences to answer the question as best as we could. Maybe next time, we could spend more time on each question the client asked. For example one question we were asked was, what would happen if we added another constraint. I think rather than just talking about it like we did we could've actually demonstrated it in GeoGebra. I think I did a really good job as my role, the only thing I would like to work on next time is stepping down. I talked a while and it might have been a little much. I think if I stepped down it would've pushed my group members to step up and talk more. Overall, I thought this experience was pretty interesting and it was definitely different than anything I had done in math before.
